Monitoring a Web Server with Panther - Part 1 (Data Ingestion)
17 Apr 2023
.
tech
.
Comments
#security
#panther
The post you are reading has been delivered from a web server with a limited attack surface, designed to minimize the risk of successful attacks. The web content served is static, with only HTTP/S and SSH ports open, and SSH access is restricted to public key authentication only. Moreover, the server is set up with automated software updates, which has allowed me to run the server worry-free for years.
While I don’t store any valuable information on the server, a compromise could lead to attackers pivoting to my personal devices that I use to interact with it. To mitigate this risk, I decided to use a Security Information and Event Management (SIEM) system like Panther to automate monitoring and detection. For instance, I would never SSH to my web server through Tor or VPN, so that’s a clear signal of compromise. Another signal of compromise would be unexpected ports being opened, which could be used for reverse shells, or unknown kernel modules being loaded to the kernel.
Data Ingestion
The first step was to set up data ingestion by identifying the sources I wanted
to monitor and sending their data to a blob storage for processing. Two sources
that seemed natural are logs coming from the ports that are open to the public
for accessing the web server, and logs from authentication attempts. Another
valuable source is the open ports of the server, which can be obtained by using
netstat. To collect and store these logs on AWS S3, I used
Fluentd and then Panther was able to collect them
from the bucket and process them:

While setting up Fluentd for the web server logs was initially challenging, I got the hang of it and was able to set up the last source in just a couple of minutes. For those interested in the Fluentd configuration, it’s available here.
Next I had to configure Panther how to process the logs. Nginx logs were the easiest to setup since there is a Managed Schema provided by Panther. However, for the authentication and netstat logs, I used pantherlog to infer the Custom Schemas needed to parse them:
./pantherlog infer --name Netstat ~/Downloads/20230416_0.json
schema: Custom.Netstat
fields:
    - name: foreign_address
      required: true
      type: string
    - name: local_address
      required: true
      type: string
    - name: name
      required: true
      type: string
    - name: process
      required: true
      type: string
    - name: protocol
      required: true
      type: string
    - name: recv
      required: true
      type: string
    - name: send
      required: true
      type: string
    - name: state
      required: true
      type: string
./pantherlog infer --name Auth ~/Downloads/20230416_25.json
schema: Custom.Auth
fields:
    - name: host
      required: true
      type: string
    - name: ident
      required: true
      type: string
    - name: message
      required: true
      type: string
    - name: pid
      required: true
      type: bigint
After creating an S3 Log Source, the final step was to attach the relevant Schemas to the respective prefixes of each source. Within minutes of completing this step, data began to flow:
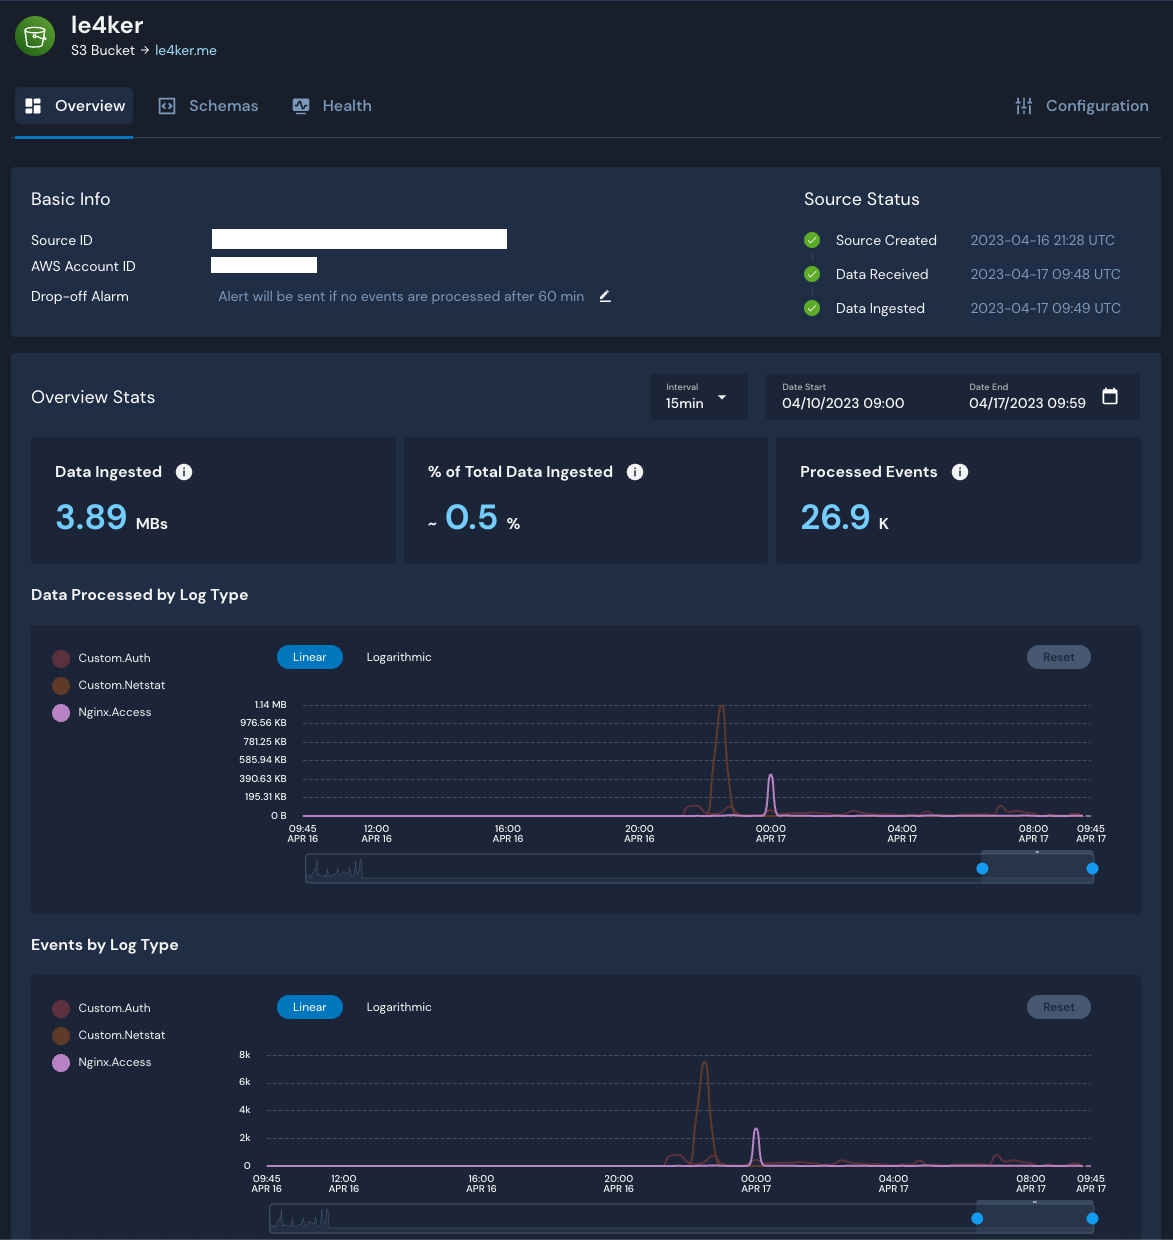
The following posts will be about enriching the data with Tor and VPN data and writing detections for monitoring and detecting successfull attacks.

A creative thinker who is not afraid to challenge the norm. His diverse track record includes failed startups, approved patents and scientific publications in top conferences and journals. On a mission to protect what matters most to you.